Mystery of deflation
--- Why has Japan experienced deflation? ---
Introduction
What is deflation?
Deflation refers to the economic situation where prices are declining on a permanent basis. If prices are rising continuously, it is inflation. It is normal for inflation to be normal. In developed countries, Japan is the only one that is deflationary. Prices are usually expressed by consumer price index.
What is the Consumer Price Index
Various goods and services such as foodstuffs, clothing, real estate, entertainment, medical care, education, etc. are provided in the world. The price is set for them, and the price goes up and down with time. There are some things that go up and others go down, but the consumer price index that captured the overall movement as seen from the consumer's point of view. According to the definition of Ministry of Internal Affairs and Communications,
Type of index
There are comprehensive indices, comprehensive (excluding food and energy) as items of price survey, and comprehensive (excluding food and energy) is suitable for seeing price trends. Because food and energy are fluctuating in price and the index including it is large up and down, it is better to use index calculated except for economic overall trends.
Calculation method
After investigating price trends for each item, we weight the price change of the item and add it. Weighting is calculated by how much consumer consumes for each item. If there is more consumption expenditure than grocery expenditure items, the weight of food products will increase and the impact on index will also increase.
Other price index
There is GDP deflator in the same as consumer price index. This is calculated by the ratio of nominal GDP to real GDP, which means price change of domestic products. While the Consumer Price Index represents the price trend of the final products (including imported items) sold in Japan, the GDP deflator represents the price trend of domestic products.
Another is the producer price index. This is an index of price trends of items (raw materials, materials) traded between companies, not items directly purchased by consumers. Prices of raw materials and materials will eventually affect the selling price of products to consumers, so it also becomes a leading indicator of the consumer price index.
Movement of consumer price index
Index
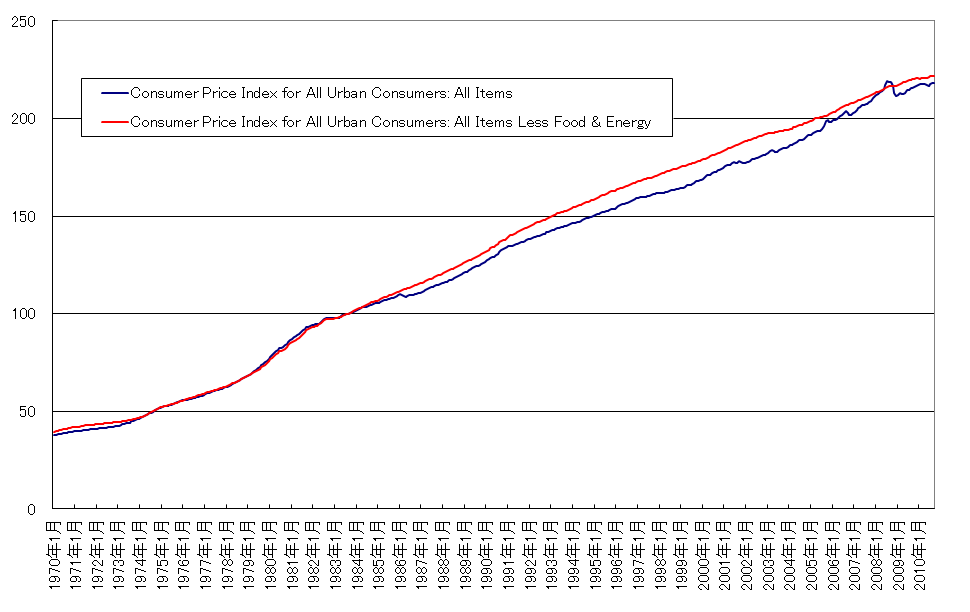
The index will be indexed with the price in 2006 as 100. The figure below shows the transition of the comprehensive index and core index. The Core Index is more gradual than the Composite Index. Looking at it over the past 40 years, it rose sharply up to 1990, then after 1998 it has declined a bit, in particular. As for the core index, it has been declining for a long time since 1998. It can be said that the inflation era until 1998, the deflation era after 1998.
 Trend of consumer price index
 compared to the same month of the previous year
Changes in prices are easier to understand compared with the same month of the previous year. Speaking of price trends in general, it refers to this figure. Generally, low inflation if 0 to 3%, high inflation if it is 3% or more, and deflation if it is a negative value. In the previous year's expenses, it was in the 8% range in the early 1980s, but it declined sharply thereafter, and it has become a downward trend although it moves up and down after 83 years. It was in the minus area after 1998.
 Consumer Price Index vs.
Compare Japan and the US
Prices trends will vary depending on economic conditions, the country's monetary policy, the structure of imports and exports, etc. The price index is generally calculated by the weighted average of the movement of goods and services prices. Weighted average results differ even if the price trends of each item do not differ from country to country because the proportion of food, clothing, durable consumer goods, entertainment, real estate, medical care differs for each country. Therefore, compared with foreign countries, the situation in Japan becomes easy to understand. Let's compare it with the United States as a representative example of a foreign country.
US index
In the United States, the Consumer Price Index continues to rise unlike Japan. However, although the degree of the rise sharply increased until 1983, it has gradually risen after that. It is in good contrast with Japan where the decline continues since 1998. In the early 1980s, it was a high inflation as high as 14%, but it declined sharply thereafter, and it fell to 5% or below in 1983. Although it moves up and down after that, it has become a gentle descent trend, and inflation is suppressed. It is currently in the range of 2 to 3%.
 Trends in the US consumer price index
  US consumer price index vs.
Comparative analysis
Although the absolute level of the inflation rate is different, the trend of the change in inflation rate is similar to that between Japan and the United States. For the past 20 years, deflationary pressures are applied not only in Japan but also in the United States. Even though the inflation rate declined in the same way since Japan was in the 8% range in the early 1980s, while the US was in the 14% range, the US stayed in the plus area, whereas in Japan the minus It can be said that it has entered the area.
Consumer price index by item
The Consumer Price Index represents the overall movement of goods and services prices. Let's see what items are boosting or depressing the consumer price index, especially after 1998 when the deflationary era is in effect.
Japan Index
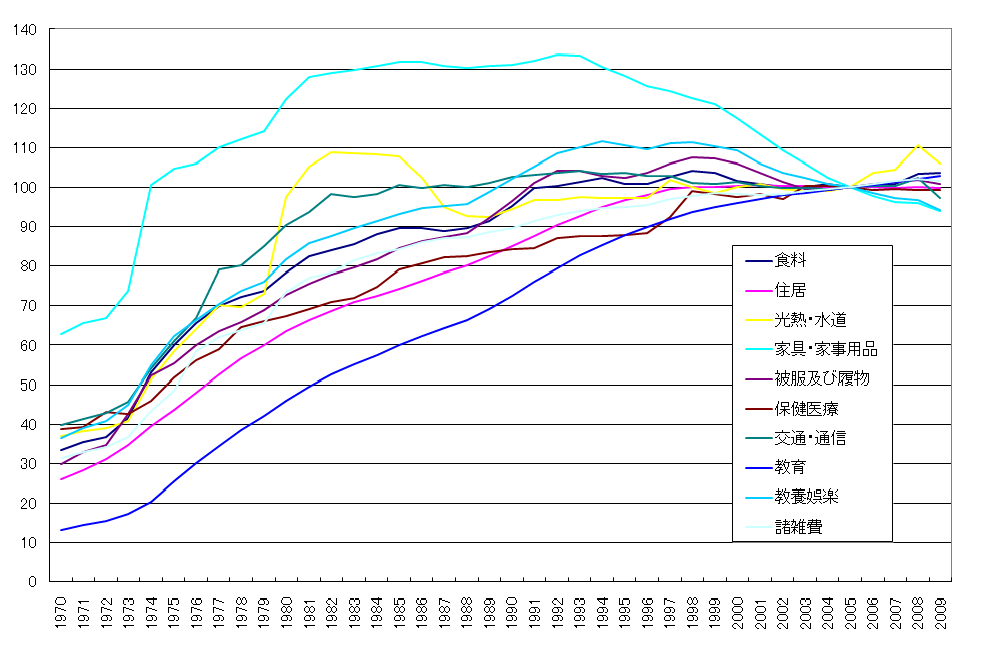
The figure below shows trends in index by item. Every item was up until 1993, but since 1993 furniture household goods and cultural entertainment have started to decline. Other than that, the rise has been weakened since 1993, and after 1998 it has become flat, with the exception of insurance medicine and education. In the deflation era after 1998, especially the decline in furniture household goods and culture and entertainment is particularly large, these two are likely to be the main causes of deflation.
 item-specific consumer price index
 US index
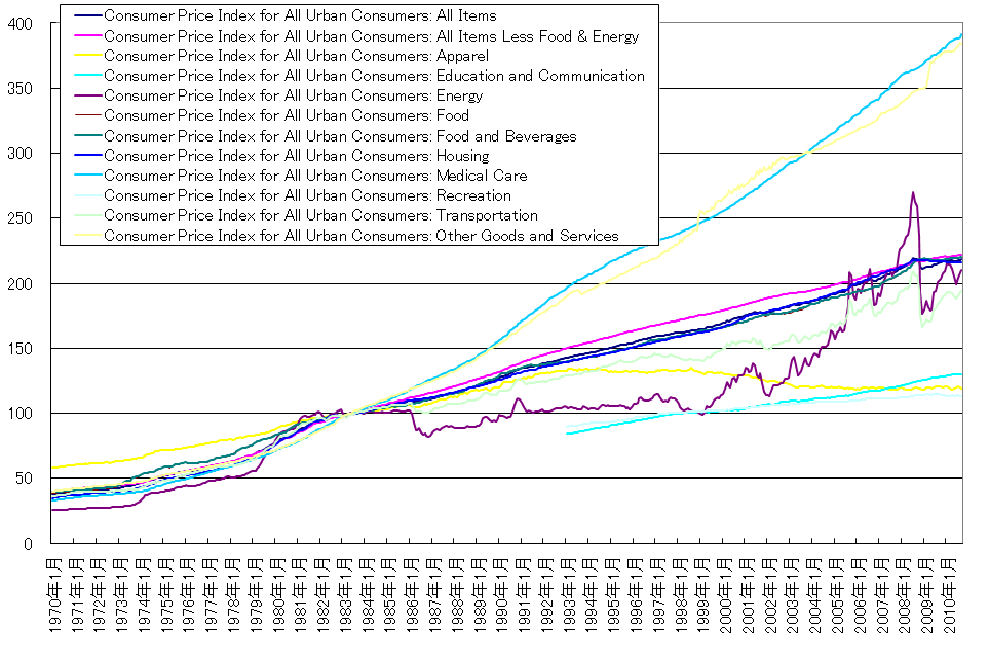
How about in the United States? Looking at the figure below, except for apparel being on a declining trend from 1992, the rest is rising all the time. Even if Japan is in the deflationary era after 1998. Especially, medical care has been consistently rising greatly. It differs greatly from Japan that is flat or falling trend since the 1990s.
 US item CPI
 Detailed Japanese Index
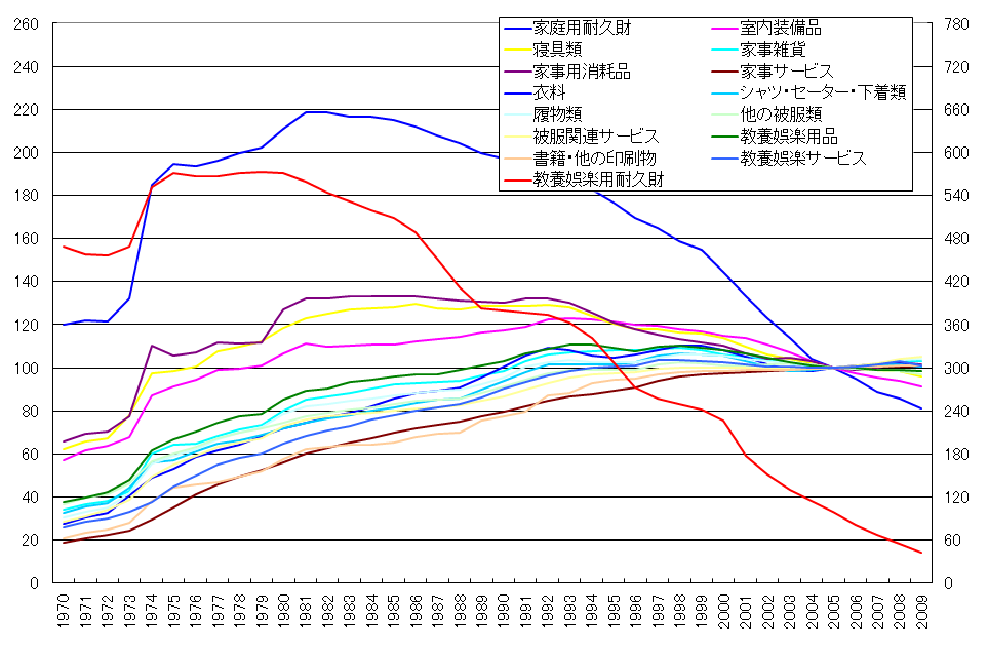
In Japan, furniture housekeeping supplies and education and entertainment are declining greatly, but let's look more closely at what is greatly deteriorating in furniture household goods and cultural entertainment. Looking at the figure below, it is durable goods for domestic durable goods and educational entertainment that have declined greatly since 80 years. It is a so-called household appliance. Technological innovation of electric appliances is intense, and mass production becomes possible by popularization, and prices tend to decline. In the price calculation, we compare price trends of products with the same performance, so if the performance improves due to innovation, the price is deemed to have declined. For this reason, in electric appliances with intense technological innovation, even if the actual market price does not decline, if the performance improves, the price will always decline on a computational basis.
 item-specific consumer price index
 Further finer Japanese index
I have examined more finely about how durable goods for domestic durable goods and culture and entertainment durable goods are going down. For household durable goods and durable goods for cultural and recreational entertainment, most items have fallen sharply. This trend has existed since the deflation era before 1998. Then why did it become a deflation since 1998? It is the personal computer that I pay attention to here. Personal computers were incorporated into the calculation of index from 00. The decline rate of personal computer prices is steepest beyond other items. In 1998 it became the turning point of deflation from inflation, but deflation is advancing after that, it may be caused by incorporation into personal computer index and price reduction.
The price of digital equipment is particularly declining in price especially compared with other items, and due to the spread of digital equipment, the proportion of consumers' expenditure also increases year by year, and the consumer price index is greatly depressed It has become a driving force.
 item specific consumer price index
 Household consumption trend
Consumption expenditure and propensity to consume
Employer compensation increased from 80 to 90's, but it peaked in 1998 and then declined. Household disposable income rose until 1998, falling since 1998. Consumption expenditure of households has also been decreasing since 1998 so as to be linked with disposable income. In other words, both income and consumption have risen to the 1990 level in the 80's range, but it has been declining since 1998. It turned out that deflation started in 1998, so declining consumption may be related to deflation.
 Employer remuneration
 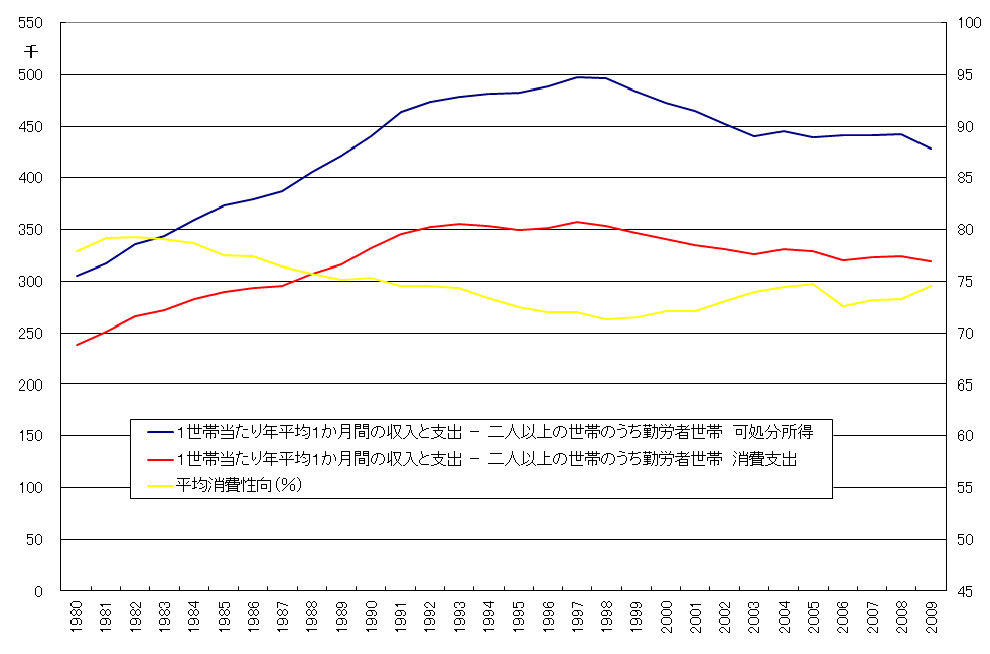 Consumption expenditure and consumption propensity
 Consumption expenditure by item
Household consumption is changing with the times. The one with the highest expenditure ratio is food, but it peaked in 1992 and then declined. Clothing and footwear, furniture household goods also tended to decrease with peaks in 1992. On the other hand, traffic and medical care are increasing year by year. Other items tend to level off at the peak around 1998.
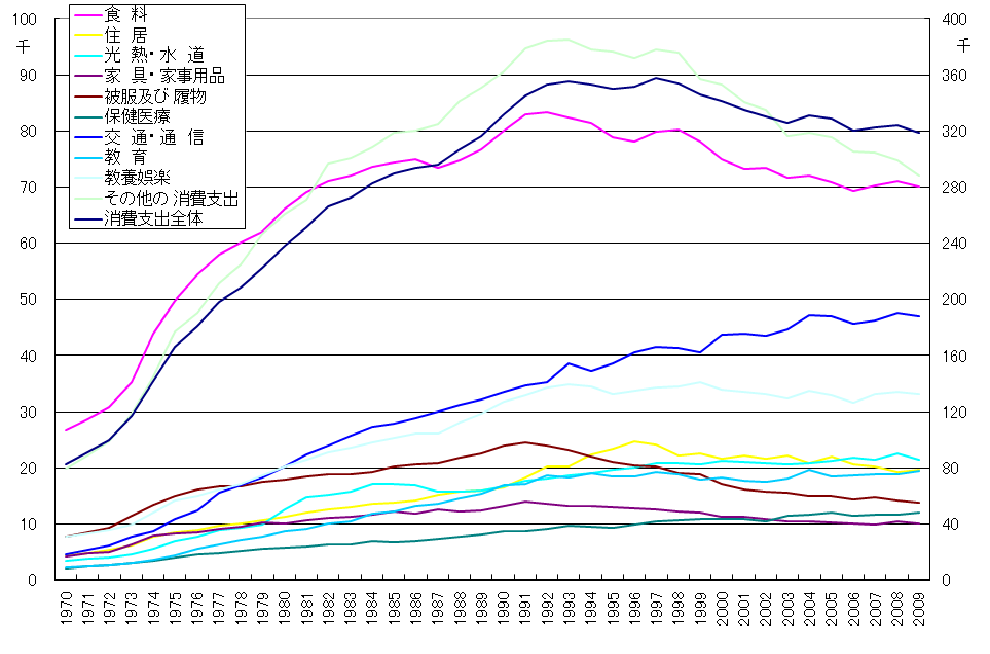 item
item  Percentage of consumption expenditure by item
 US disposable income, item-specific consumption expenditure
How about in the United States? Disposable income has been rising consistently until 2008 before the Lehman shock. Consumption expenditure has also been increasing through 2008. Both total consumption expenditure and item-specific consumption expenditure rose sharply from 2003 to 2007. In other words, unlike Japan, income and consumption have consistently increased until the Lehman shock in 2008. In the long term, inflation has become moderate compared to the 1980s, but it is still not deflation. Consumption expenditure by item is different from that in Japan. In the United States, expenditure on food products is lower than in Japan, expenditure for medical and real estate is high.
 US disposable income, consumption consumption by item
  Percentage of item consumption expenditure by item in the United States
 Contribution to Consumer Price Index
The Consumer Price Index is a composite indicator weighted by weighting the price changes of various products according to the consumption scale of the product. Therefore, price change of products with large consumption scale will affect consumer price index more than products with small consumption scale. In order to measure the degree of influence, we calculate contribution degree = price change × consumption scale. We calculate the contribution to the consumer price index for each item that makes up the consumer price index and see what has changed consumer price index, in particular what went after deflation in 1998 . To calculate the contribution rate, multiply the price change of each item by the household expenditure expenditure percentage and calculate the magnitude of change in the price index of each item.
Contribution by item
Every item in the 1970s contributed a positive contribution to the consumer price index, that is, it was a factor to raise it, but it declined year by year, entering the minus sphere by the marginal plus sphere in the 1980s and in the 1990s Items also appeared. Focusing on the deflation era after 1998, furniture household goods and educational entertainment are consistently high in contribution from 1998 onwards. It can be said that these two are depressing the consumer price index.
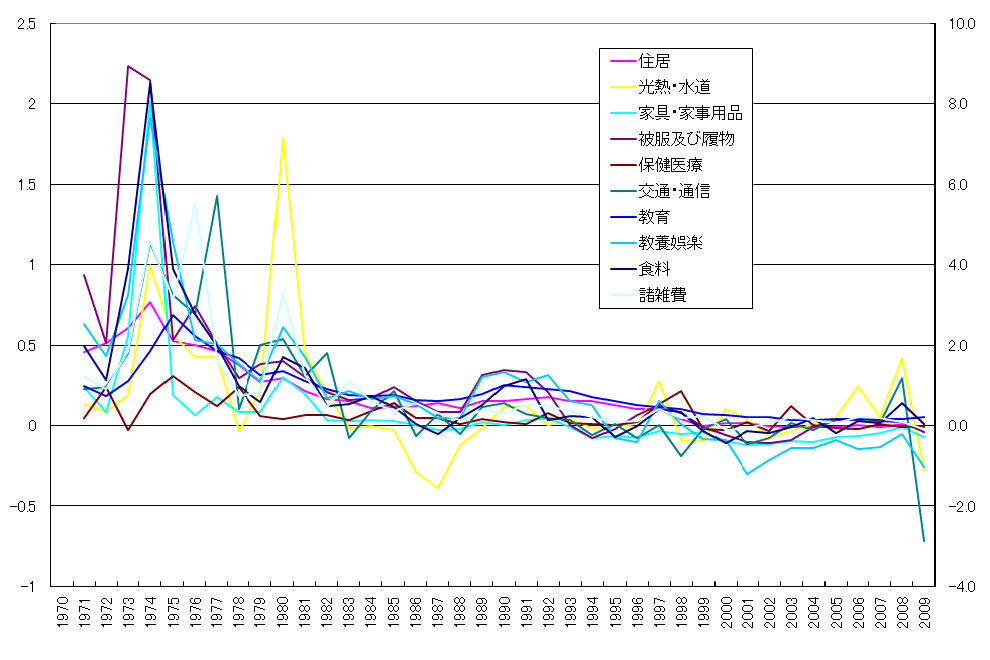 item-specific contribution to the consumer price index
 Causes of Consumer Price Index Decline
In terms of contribution, the consumer price index is pushing down furniture household goods and cultural entertainment. Furniture Durable consumer goods are the most important as to what is going down in household goods and cultural entertainment. Among them, the price of PC falls intensely. Personal computers are large in consumption scale alongside LCD TVs, mobile phones among durable consumer goods. The deflation after 1998 seems to have been greatly influenced by the inclusion of personal computers into the consumer price index and the depression of the consumer price index due to the size of the price decline and the size of the consumption scale.
Deflation is caused by the appreciation of the yen?
Recent yen appreciation has been taken up as a cause of deflation. If the yen appreciates against the dollar, it will result in a drop in the price of imported goods in importing and exporting where there are many settlements in dollar denominations. As for imports, not only the final product but also raw materials and energy are many, and these price reductions will also spread to the final product. In addition, the yen's high economic recession caused by the decline in export competitiveness due to the appreciation of the yen is also said to be part of deflation. Let's examine this.
Dollar yen rate and consumer price index
The dollar yen rate moved greatly in the yen from the 1980s to the 1990s. However, focusing on the deflation era after 1998, the yen appreciation has not continued for a long time, and until the year 2007 it has repeatedly depreciated against the yen. Therefore, the dollar yen rate and the consumer price index did not move in conjunction. The latter half of the 1980s and the first half of the 1990s, when the yen appreciated most rapidly, have not fallen into deflation.
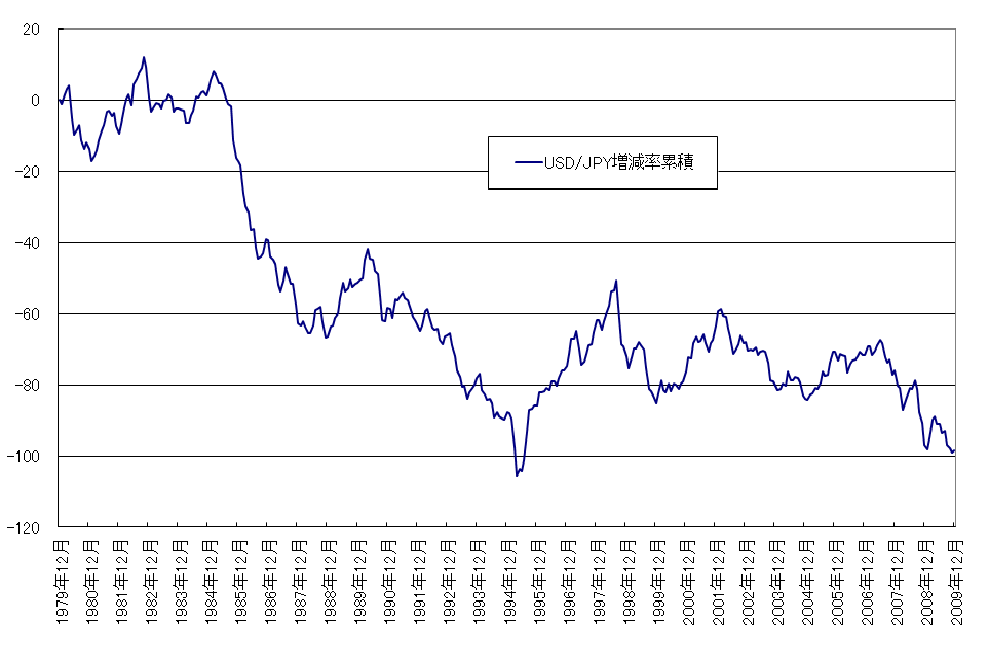 Dollar yen rate and consumer price index
 Effective exchange rate and import and export price index
Looking at the value of the yen at the nominal effective exchange rate, it is rising until 1985, but after that it turns up and down repeatedly, which shows that it is not necessarily a one-way yen appreciation.
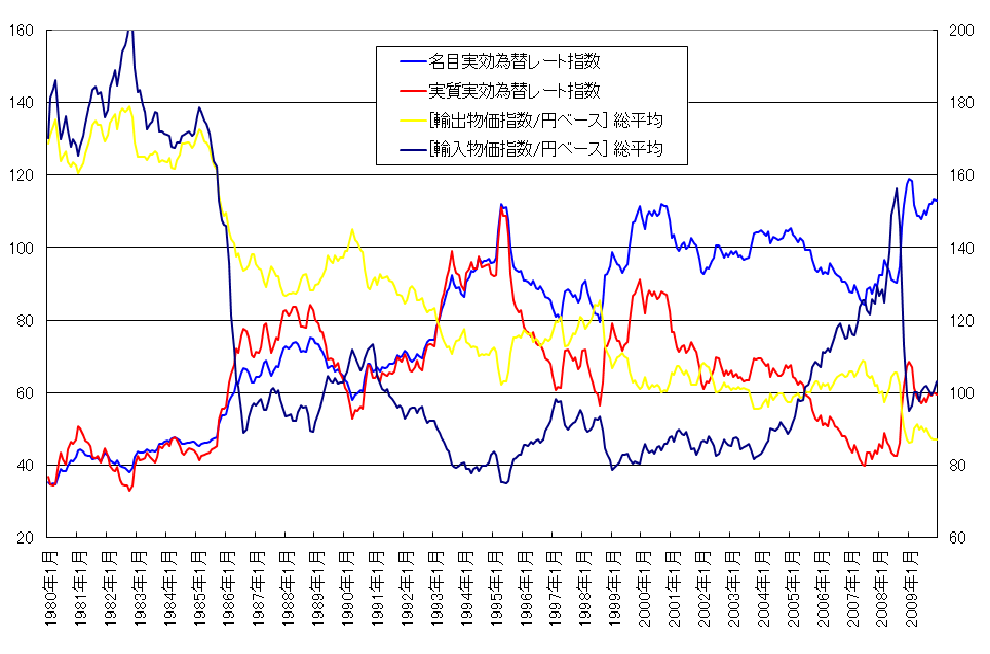 effective exchange rate and import and export price index
 Import and export price index and consumer price index
The import price index fell sharply from the latter half of the 80s to the early 1990s, but remained flat after 1995, and it rose greatly from 2003 to 2007. On the other hand, the export price index has been decreasing all the year, which means that production costs are declining year by year, given that Japanese export products are centered on industrial products. Looking finely after the deflationary era in 1998 and thereafter, the consumer price index is negative in the price index year-on-year, whereas the import price index is in the positive sphere. The majority of imported goods are industrial raw materials and energy, not final consumer goods, but it can not be said that imported goods lead the price decline.
 Import and Export Price Index and Consumer Price Index
 It can not be said that the yen is high
As to whether the yen appreciation is the cause of deflation, the yen's appreciation lowers the price of the final product of imported goods, or competition with imported goods causes price reduction of domestic products It is also possible that there is a hypothesis that the improvement of production cost due to the decline of imported raw materials energy prices leads to a decline in product prices. However, what the statistics show is not becoming a one-sided appreciation of the yen since 1995. The price index of imported goods (yen denominated) moves in conjunction with the leveling or rising of the international consumption price (dollar denominated), the fluctuation of the commodity price is larger than the change of the exchange rate, so the effect of the appreciation of the yen will not appear It is getting. Imported goods are rather rising in price, and the exchange is not the cause of deflation.
Conclusion
Durable consumer goods are the number one thrusting down the consumer price index. Among durable consumer goods, consumption scales along with liquid crystal TVs and mobile phones are large, and deflation after 1998 is mainly due to the inclusion of personal computers into the consumer price index, the size of the price decline and consumption scale It seems that the effect of pressing down on the consumer price index coming from the size was great. The change in foreign exchange (yen appreciation) is not the cause of deflation.